What Is Flag Chart Pattern?
The flag chart pattern is another technical analysis pattern commonly observed in financial markets. It is named for its resemblance to a flag on a flagpole. The pattern typically occurs after a sharp price movement or trend and is considered a continuation pattern.
The flag pattern is typically a temporary pause or breather in the market before the price continues its prior trend. It signifies that market participants are taking a break or consolidating their positions after the sharp move. The duration of the flag formation can vary, lasting from a few days to several weeks.
The key features of the Flag pattern are as follows:
It is a continuation pattern in the market trend.
It can be formed in both ascending and descending trends.
It consists of a rod and a flag.
The bar shows the strong growth or decline of the price.
The flag indicates the consolidation of the previous trend.
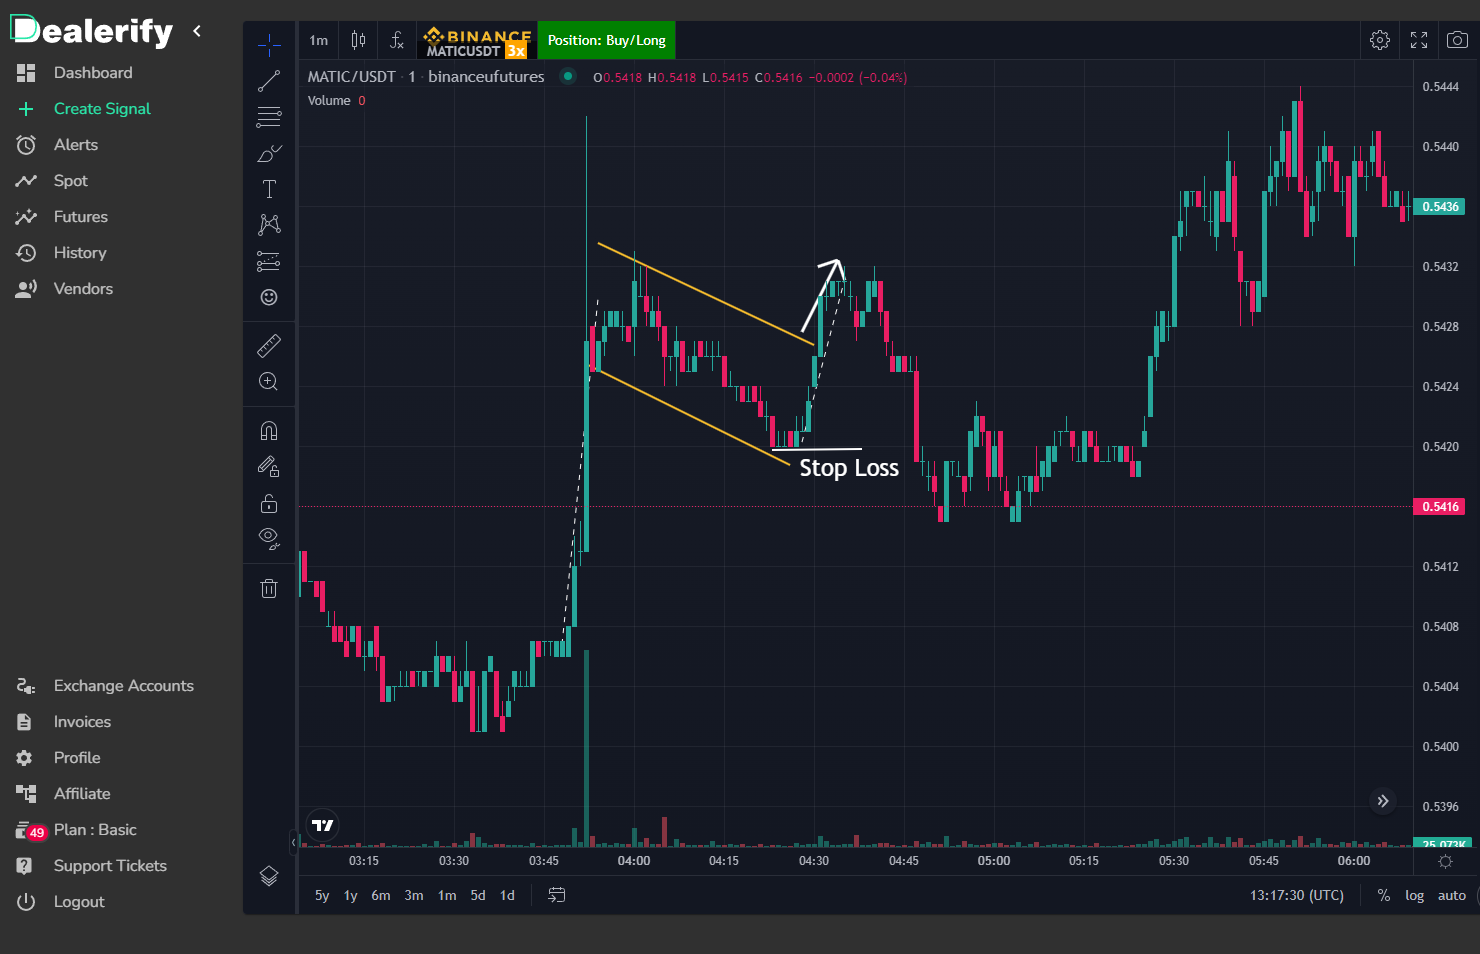
In an upward trend, a line is formed by connecting the ceilings of the flag, which you can enter into a trade whenever the price breaks it and makes a pullback.
In a downward trend, a line is formed by connecting the bottoms of the flag, which you can enter into a trade whenever the price breaks it and makes a pullback.
The profit limit is the size of the bar from the breaking point of the flag.
The loss limit in the upward trend is slightly lower than the last bottom formed in the flag.
The loss limit in the downward trend is slightly higher than the last ceiling formed in the flag.
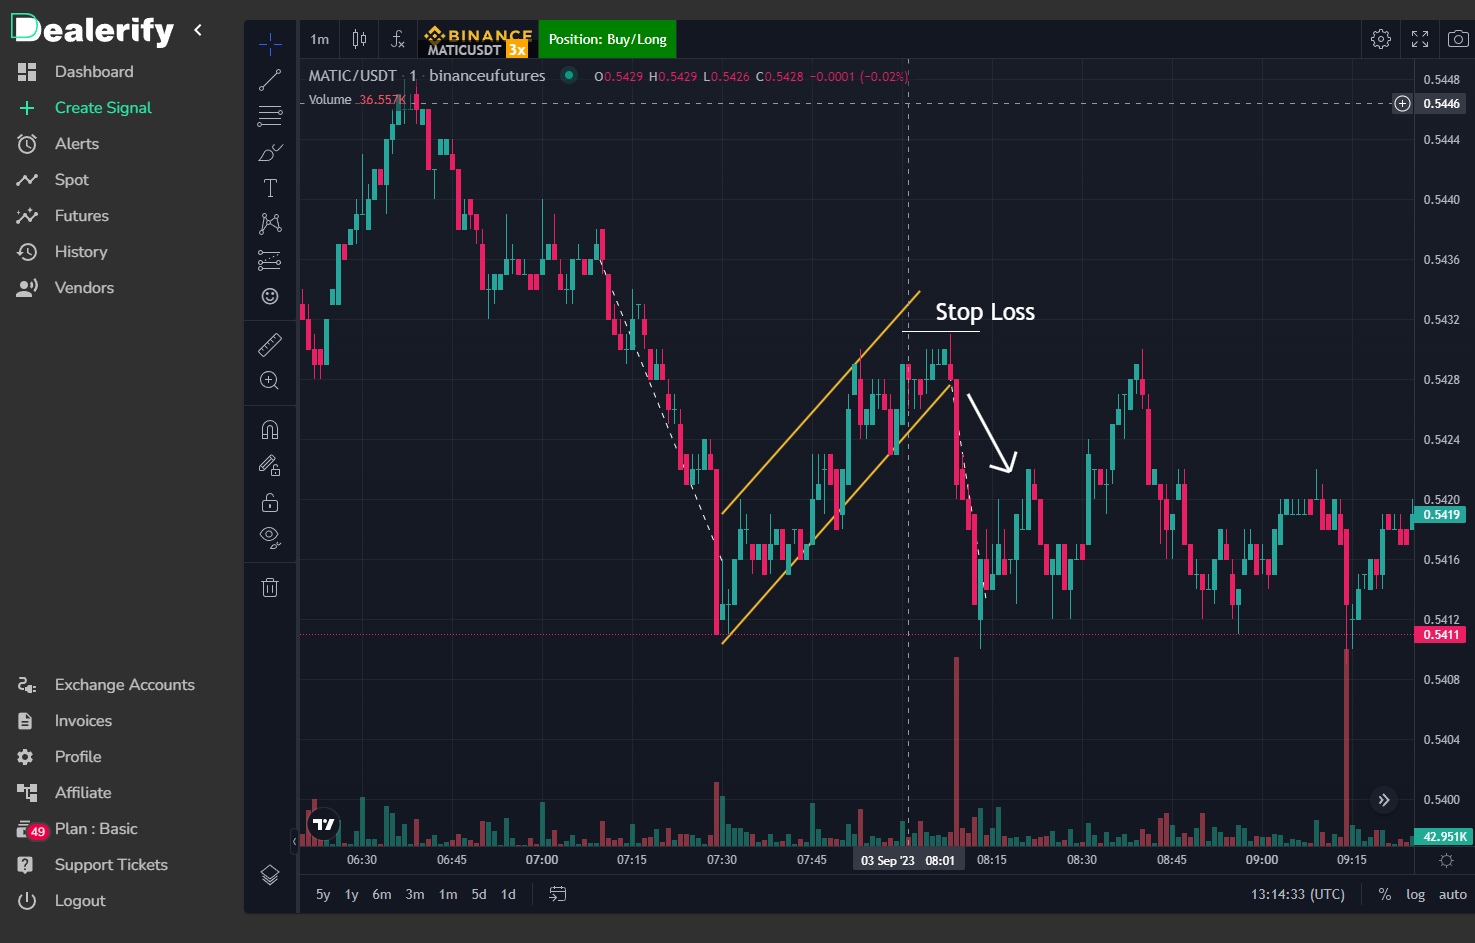
Flagpole: The flag pattern starts with a strong and sharp price movement, known as the flagpole. It can be either an upward or downward movement and represents a significant price surge or decline. The length of the flagpole can vary, but it should be a noticeable and rapid move.
Flag Formation: After the flagpole, a consolidation phase occurs, forming the flag. The flag is characterized by a rectangular or parallelogram-shaped price pattern, where the price moves within a narrow range. It typically exhibits smaller price swings compared to the initial flagpole. The flag is formed by two parallel trend lines—an upper trend line acting as resistance and a lower trend line acting as support.
Duration: The flag formation can last from a few days to several weeks, depending on the timeframe being analyzed. The duration of the flag pattern should be relatively shorter compared to the duration of the prior trend.
Volume: During the flag pattern formation, trading volume tends to diminish compared to the volume observed during the flagpole. This reduction in volume indicates a decrease in market activity and a period of consolidation.
Continuation Pattern: The flag pattern is considered a continuation pattern, implying that it suggests a potential continuation of the prior trend after the consolidation phase. If the prior trend was bullish, a bullish flag breakout is expected, indicating a resumption of the upward trend. Conversely, if the prior trend was bearish, a bearish flag breakout is anticipated, signaling a continuation of the downward trend.
Breakout: Traders closely monitor the breakout from the flag pattern. A breakout occurs when the price moves above the upper trend line (bullish breakout) or below the lower trend line (bearish breakout) of the flag. Breakouts are often accompanied by an increase in trading volume, providing confirmation of the pattern’s validity.
The concept of the Flag chart pattern:
Once the flag pattern is formed, traders often look for a breakout in the direction of the prior trend. In an uptrend, a bullish breakout occurs when the price moves above the upper trend line of the flag. In a downtrend, a bearish breakout occurs when the price drops below the lower trend line of the flag. These breakouts are often accompanied by an increase in trading volume, indicating renewed market interest and potential continuation of the prior trend.
The flag pattern consists of two main components:
Flagpole: The flagpole is the initial strong and rapid price movement that precedes the formation of the flag pattern. It can be either an upward or downward movement and represents a significant price surge or decline.
Flag: The flag is a consolidation phase that follows the flagpole. It is characterized by a rectangular or parallelogram-shaped price pattern, where the price moves in a narrow range and exhibits smaller price swings compared to the initial flagpole. The flag is formed by two parallel trend lines—one acting as resistance (upper trend line) and the other as support (lower trend line).
Caution
It’s worth noting that the flag pattern is not a guarantee of future price movements, and false breakouts can occur. Therefore, it is important to use the flag pattern in conjunction with other technical analysis tools and market information for comprehensive analysis and decision-making.
It’s important to note that like any technical analysis pattern, the flag pattern is not foolproof and should be used in conjunction with other indicators and market analysis to make well-informed trading decisions.