What Is Triangle Chart Pattern?
A triangle chart pattern is an important technical analysis pattern that occurs when the price of a cryptocurrency forms a triangle shape on a price chart and due that shape called triangle pattern.
This pattern can reverse or continue in the market trend and is created when the price forms a series of higher lows and lower highs, with the trend lines converging towards a point. The triangle chart pattern can provide traders with valuable information about the future direction of a cryptocurrency price movement.
The key features of the Triangle pattern are as follows:
A triangle chart pattern may be formed in both bullish and bearish trends.
The process will continue from any side that breaks the line created by the ceilings or floors and pulls back on it.
The take profit limit is equal to the base of the triangle from the break point.
The stoploss limit in ascending mode is slightly lower than the last bottom made inside the triangle.
The stop loss limit in the descending mode is slightly higher than the last ceiling built inside the triangle.
The concept of the Triangle chart pattern:
There are three types of triangle chart patterns: ascending, descending, and symmetrical:
- An ascending triangle pattern forms when the price of the cryptocurrency is making higher lows and is characterized by a horizontal resistance level and a rising trend line. This pattern indicates that buyers are becoming more aggressive and are pushing the price towards a potential bullish breakout. Traders may look for the price to break above the resistance level to confirm the pattern and consider entering long positions when the price breaks above the resistance level.
- A descending triangle pattern forms when the price of the cryptocurrency is making lower highs and indicates that sellers are becoming more aggressive and are pushing the price towards a potential bearish breakout. This pattern is characterized by a horizontal support level and a falling trend line. It typically indicates a bearish continuation, and traders may enter short positions when the price breaks below the support level. Traders may look for the price to break below the support level to confirm the pattern and consider entering short positions.
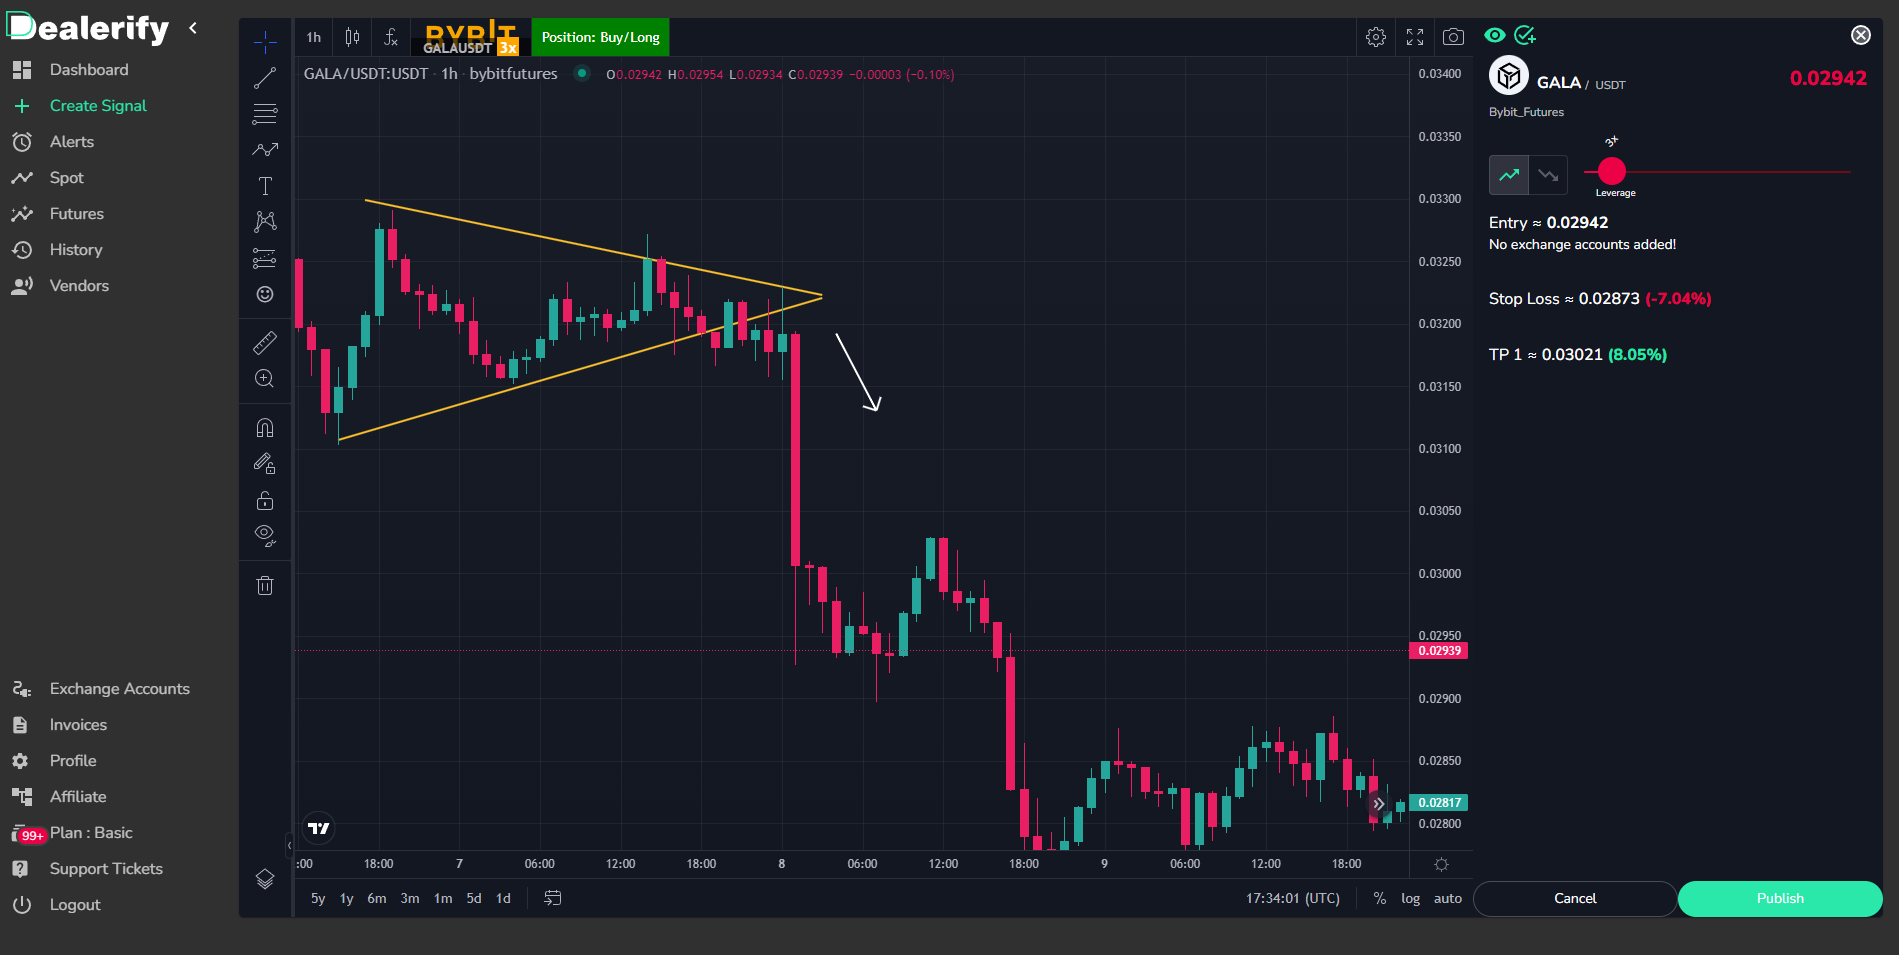
- A symmetrical triangle pattern forms when the price of the cryptocurrency is making lower highs and higher lows, creating a converging trendline. It does not have a clear bias towards bullish or bearish continuation, and traders may wait for a breakout in either direction before entering a trade. This pattern indicates that the cryptocurrency is experiencing a period of consolidation and may be preparing for a significant move in either direction. Traders may wait for a breakout above or below the trendline to confirm the pattern and consider entering a position.
Caution
It’s important to note that while the triangle chart pattern can provide traders with useful information, it is not always reliable and should be used in conjunction with other forms of analysis.
However, traders should also be aware of false breakouts, where the price briefly breaks out of the pattern before quickly reversing direction.