What Is The Hammer Candlestick Pattern?
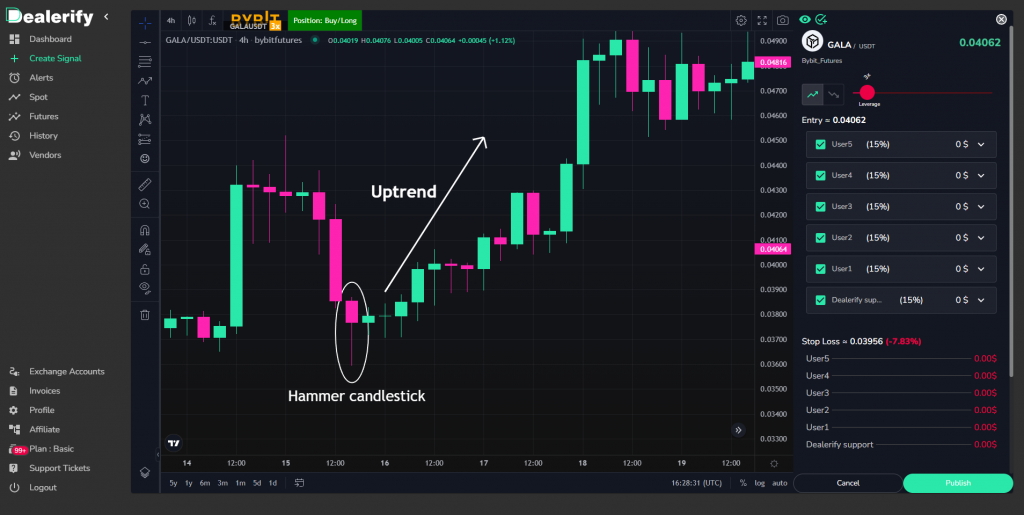
The hammer pattern is a very important bullish reversal pattern that forms in the downward trend and is commonly used in technical analysis to identify potential reversals in price trends. In fact, the hammer candlestick is one of the signs of the beginning of the upward trend, and price start moving up.
The pattern gets its name from its resemblance to a hammer, with the long lower shadow like the handle of the hammer and the small body like the head.
The key features of this pattern are as follows:
- The hammer is formed by a single candlestick
- The main body of the candle is at the top and it is small
- The lower shadow is longer than the body (at least twice the size of the real body)
- It usually does not have an upper shadow and if there is an upper shadow, it is small.
The concept of hanging man candlestick pattern:
The hammer pattern suggests that buyers are about to enter the market so it caused the move up in the price and shows the end of a downtrend.
The long lower shadow in a hammer pattern indicates that sellers were able to push the price down significantly, but buyers were able to overcome the selling pressure and that a potential reversal may be in the works.
In general, the hammer pattern can be a useful signal for traders and when traders see this pattern, they may interpret it as a potential to buy and place a long position.
Caution
It’s also important to note that while the hammer pattern can be a powerful signal, it is necessary to use the pattern in conjunction with other technical indicators. When you see this candle in the price chart, look for other bullish signals such as increasing volume, a break above a trendline, or a crossover of a moving average, and then according to the market trend and resistance and support areas, you can enter a long position.