What Is the Rectangle Chart Pattern?
The rectangle chart pattern is an important and simple technical analysis pattern that mostly forms neutral market trends.
A rectangle pattern occurs when the price of a pair is placed between two parallel lines for an extended period of time and creates a rectangle box shape on a price chart. This pattern is a useful tool for traders to identify potential trading opportunities and make informed trading decisions.
The key features of the Rectangle pattern are as follows:
- The rectangle pattern is formed by drawing two parallel horizontal lines to connect the highs and lows of the price.
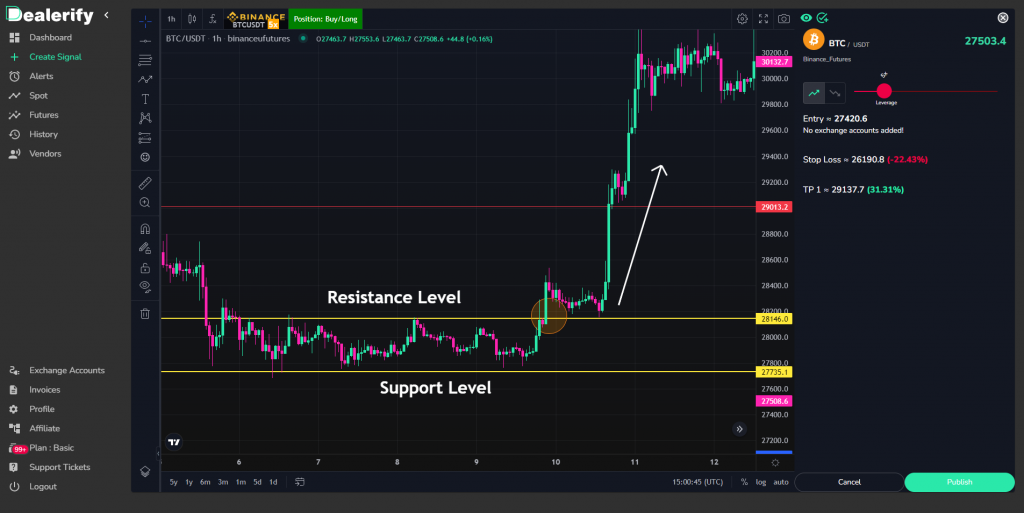
- In this pattern, the price fluctuates between the resistance level and the support level.
- It may be formed in both bullish and bearish trends.
- The break of the rectangle pattern from the top line of the box is a sign of the buy position.
- The break of the bottom of the rectangle pattern is a sign of the sell position.
- The amount of take profit in this pattern is equal to the distance between the top and the bottom of the channel.
- The amount of stop loss in this pattern is half of the range of the channel.
- The rectangle pattern is usually considered a continuation pattern, meaning that the price is likely to continue in the same previous direction.
The concept of the Rectangle chart pattern:
Traders use the rectangle pattern to identify potential trading opportunities. They typically enter a long position when the price breaks above the resistance level and enter a short position when the price breaks below the support level.
This pattern is usually considered a continuation pattern, meaning that the price is likely to continue in the same direction, but it can also be a reversal pattern if the price breaks out of the pattern in the opposite direction.
Caution
Pay attention to this point that the rectangle pattern is just one tool used in technical analysis, and traders always use these patterns in conjunction with other indicators and analyses to make their trading decisions.