
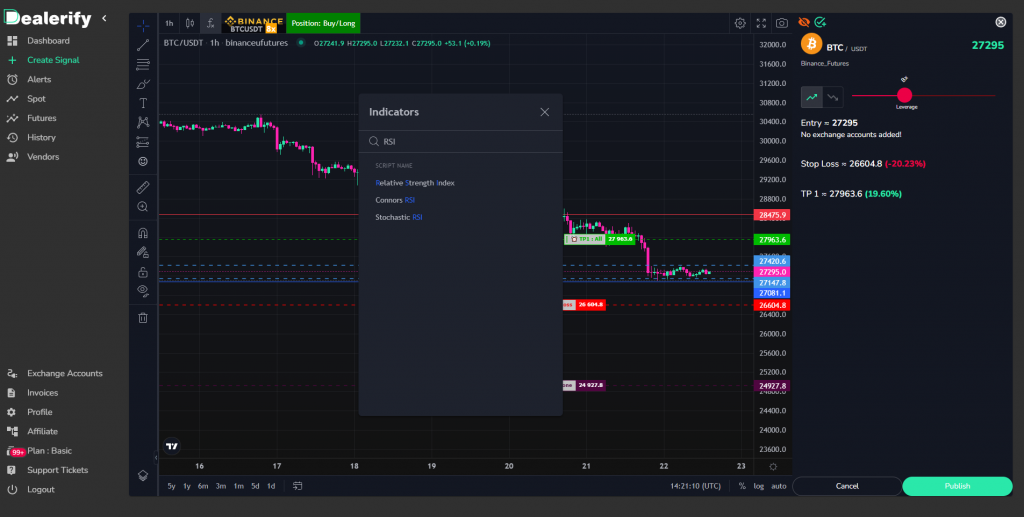
What Is RSI Indicator?
The Relative Strength Index (RSI) is one of the return technical analysis indicators used by traders to measure the strength of a pair’s price action. RSI determines the return points and levels and shows the strength of buyers and sellers relative to each other over a specified time period, usually 14 periods.
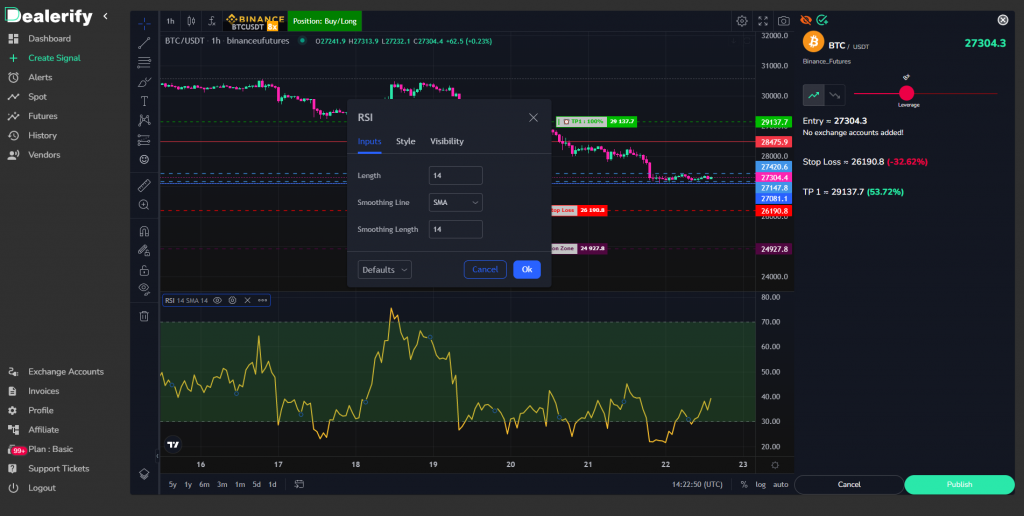
The RSI line is plotted as a line oscillating on a chart below the price chart and fluctuated between 0 and 100. If it rises above 70, generally considered overbought, and if it falls below 30, it suggests oversold. Traders use this information to make decisions about when to buy or sell a security.
RSI formula
The RSI is calculated using the following formula:
RSI = 100 – (100 / (1 + RS))
Where RS = Average of x days’ up closes / Average of x days’ down closes
The key features of RSI are as follows:
– RSI is an oscillator that fluctuates in two levels from 0 to 100
– The 30 and 70 lines are two important lines in this indicator
– RSI usually fluctuates between 30 and 70 lines in the neutral trends of the RSI main line
– The horizontal line of 30 indicates an oversold condition
– The horizontal line of 70 indicates an overbought condition
– The horizontal line of 50 is also an important line
– RSI usually is set to a period of 14 in relation to the time frame (if the time frame is daily, RSI examines the last 14 days, and if the timeframe is hourly, the last 14 hours and so on.)
The concept of RSI indicator:
The Relative Strength Index oscillates between 0 and 100, There are 2 important levels on the 30 and 70 lines that indicate overbought and oversell conditions.
when the RSI crosses above the 70 levels in fact it is reached the overbought zone, the price is too high in this condition and it gives you a sign of a sell signal. and when the RSI line crosses below the 30 levels that is an oversold zone so it indicates the price is too low and it is a sign of a buy signal.
Traders also look for divergences between the RSI and the price chart of the pair. If the RSI is making higher lows while the price is making lower lows, it could signal a potential trend reversal to the upside. On the other hand, if the RSI is making lower highs while the price is making higher highs, it could signal a potential trend reversal to the downside.
The RSI can be used on various timeframes, from short-term intraday trading to longer-term swing trading.
Methods of receiving signals from RSI
Before using these methods, keep in mind that the signals of this indicator alone are not valid enough to enter the transaction and should be used along with other analysis tools to confirm the technical analysis.
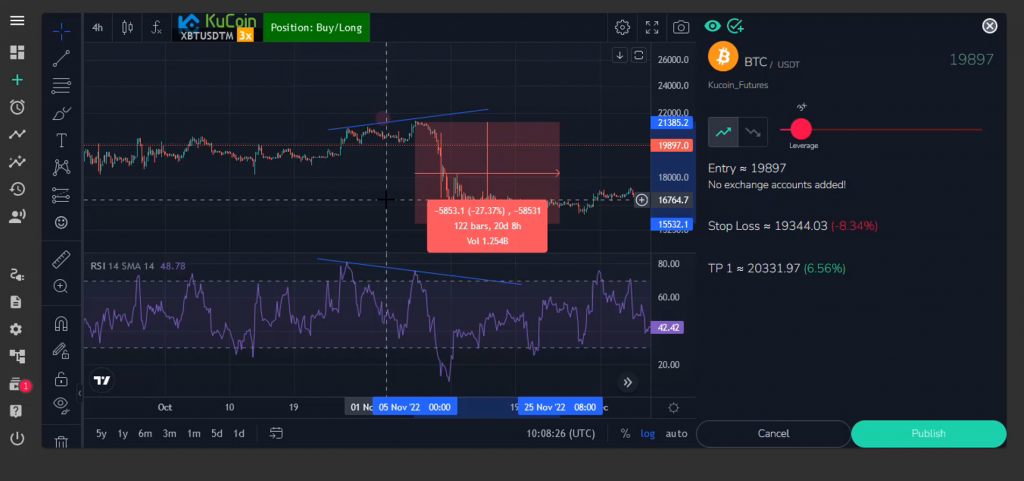
- Signal through RSI trend line
One of the ways that traders get a signal from RSI is to use a trend line. They draw the trend line on the RSI and if the main line breaks the trend line and pulls back to it, it is considered a trade entry signal.
- Signals through Overbought/Oversold Levels:
Traders use the 70 line (overbought) and 30 line (oversold) levels as a potential to enter short and long (buy/sell) positions. When the RSI is above 70, it indicates that the pair is overbought, and when it falls below 30, it indicates that the pair is oversold.
- Signal through negative divergence (Bearish divergence)
Sometimes in the price chart, we see an upward trend in the way that we see a peak higher than the previous peak, but in the RSI we see an opposite trend in the way that we see a peak lower than the previous peak, in this case, so to speak We have encountered a negative divergence, which indicates the end of the upward trend. A very important point is that the second peak must be formed in the chart and then a few candles lower, and then we enter the sale transaction.
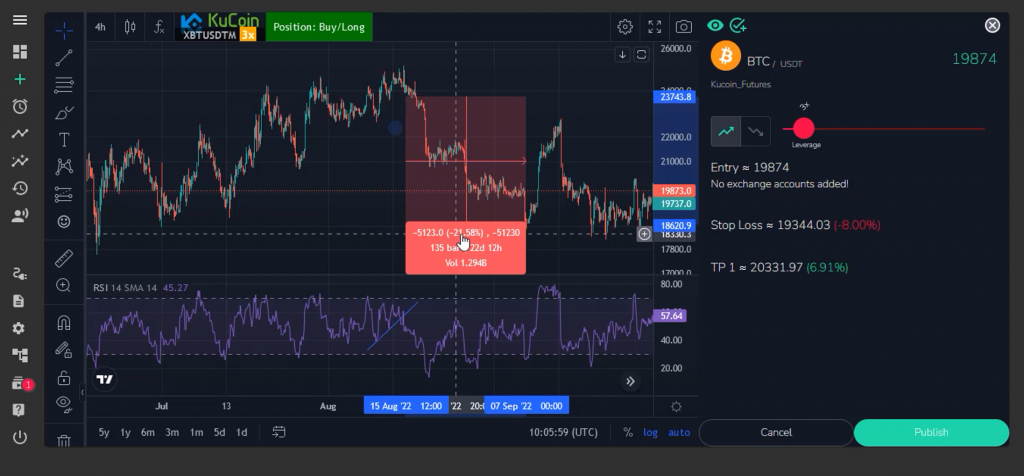
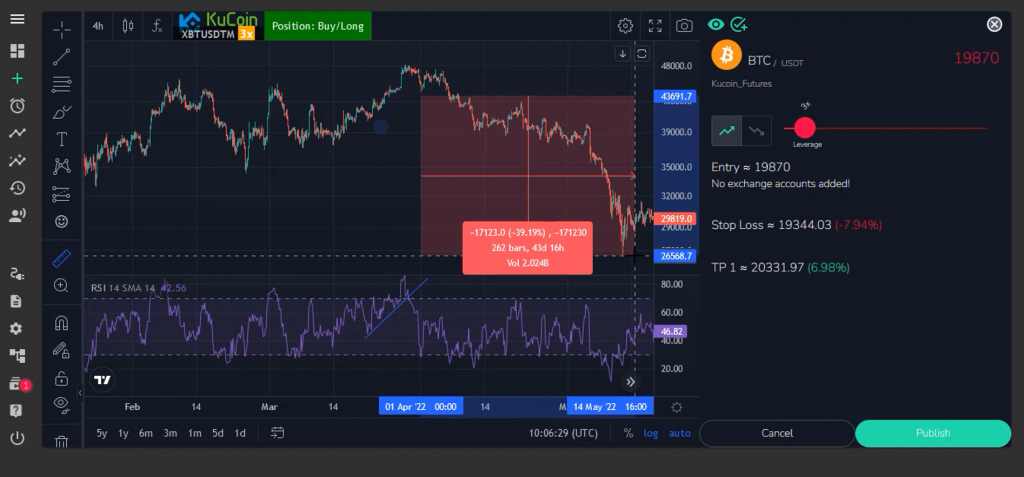
- Signal through positive divergence (Bullish divergence)
In the chart, we see a floor that is lower than the previous floor, but in the RSI we see a floor that is higher than the previous floor, in this case, we have encountered a positive divergence, which indicates the end of the downward trend. Pay attention to entering the purchase transaction when several candles are formed after the last floor.
Traders use various methods to receive signals from the RSI indicator. Some of the common methods are:
- Signals through Centerline Crossover:
Traders use the centerline crossover as a signal to enter or exit trades. When the RSI crosses above the 50 levels, it indicates bullish momentum, and when it crosses below the 50 level, it indicates bearish momentum.
Caution
It’s important to remember that the RSI is just one technical tool traders use to analyze the market, and it should not rely upon just one indicator for making trading decisions.
It’s necessary to use RSI in combination with other indicators and fundamental analysis and make trading decisions.